

Banking Analytics Tool

One set of numbers your executive committee can agree on.

Product, channel, branch and customer performance built on data models made for banking, so every department reads from the same source.

For finance, product, channel and risk teams who need the same numbers

Banking data modelsPerformance dashboardsRegulatory reporting
From

Three departments, three different numbers

To

One source of truth for every decision

What we offer

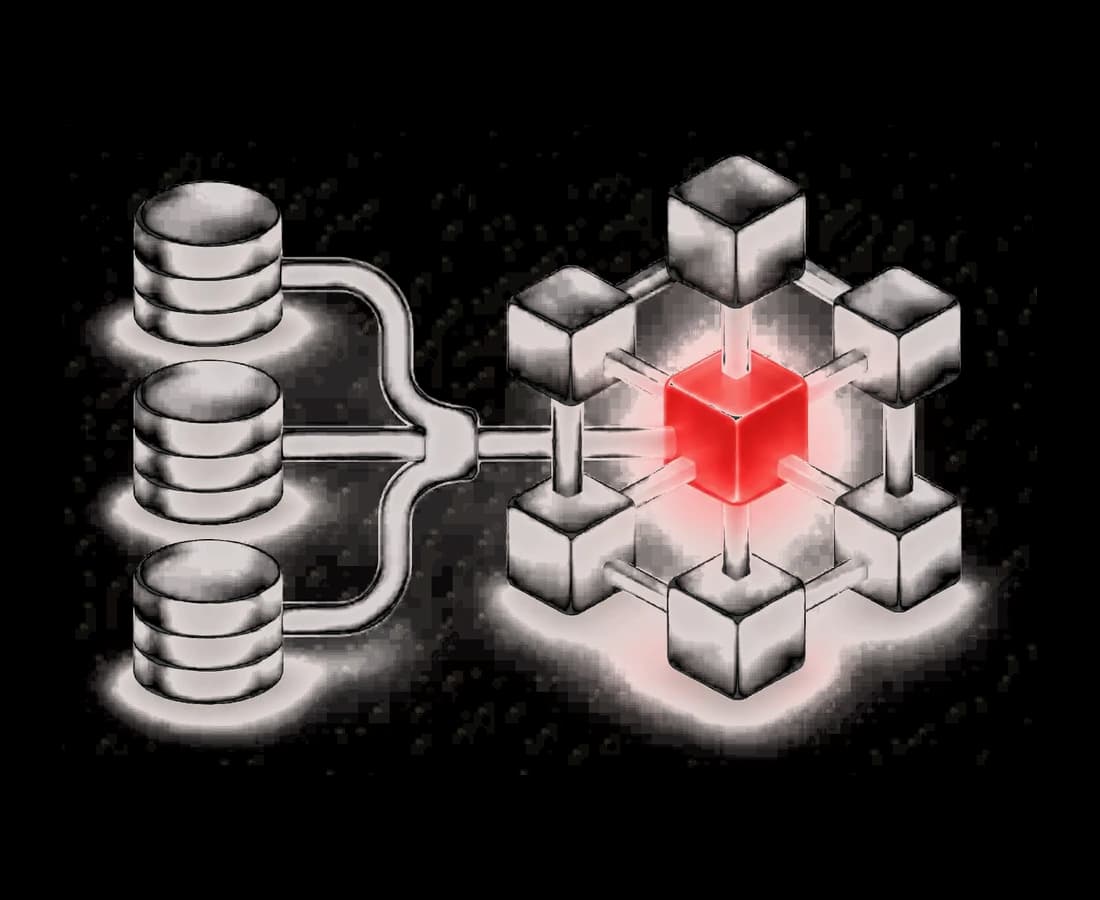
Glass databases pipe into a stacked cube model; the cube at its heart is red
How we work
  1. Connect your core banking and channel data
  2. Load pre-built banking data models
  3. Reconcile the figures with finance
01

Banking Data Models

Built for accounts, products, channels and customers.

The challenge

Every team builds its own extract from the core, so figures disagree before anyone opens a dashboard.

What you receive
  • Pre-built banking data models
  • Automated data loads from your core
  • Reconciled, documented definitions
The outcome

Numbers that agree, because they come from one place.

  1. Glass databases pipe into a stacked cube model; the cube at its heart is red
    01 / 03

    Banking Data Models

    Built for accounts, products, channels and customers.

    The challenge

    Every team builds its own extract from the core, so figures disagree before anyone opens a dashboard.

    How we work
    1. Connect your core banking and channel data
    2. Load pre-built banking data models
    3. Reconcile the figures with finance
    What you receive
    • Pre-built banking data models
    • Automated data loads from your core
    • Reconciled, documented definitions
    The outcome

    Numbers that agree, because they come from one place.

  2. A glass dashboard with one tall red bar, watched by two white pawns
    02 / 03

    Performance Dashboards

    Products, channels, branches and segments.

    The challenge

    Management packs take days to assemble and are out of date by the time they are read.

    How we work
    1. Agree the measures each team runs on
    2. Build dashboards on the shared model
    3. Roll out with training for each team
    What you receive
    • Product, channel and branch performance
    • Customer segmentation and profitability
    • Self-service views for each department
    The outcome

    Meetings spent deciding, not reconciling.

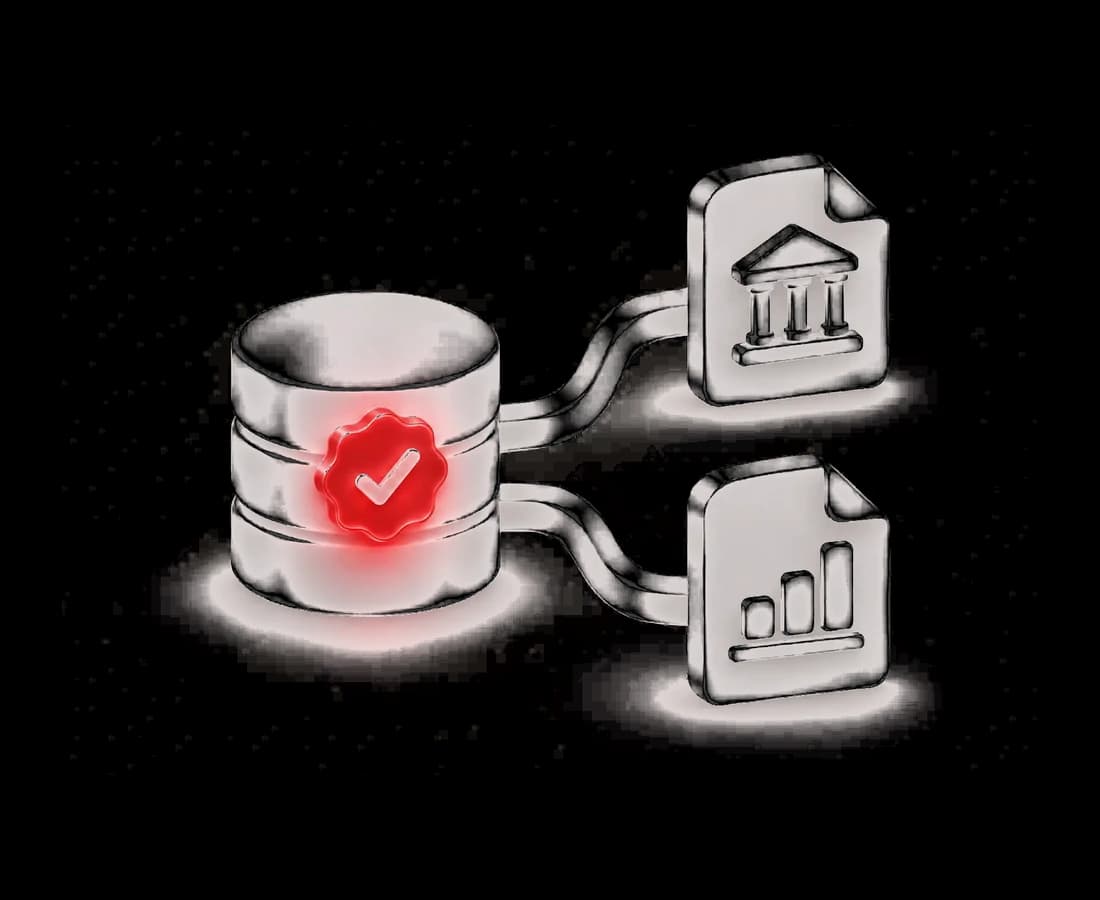
  3. One glass database splits into a regulator report and a board report, sealed with a red tick
    03 / 03

    Regulatory & Management Reporting

    The same source for the regulator and the board.

    The challenge

    Regulatory returns are built by hand from spreadsheets, a slow process with plenty of room for error.

    How we work
    1. Map the returns to the data model
    2. Automate the recurring reports
    3. Add checks and sign-off before submission
    What you receive
    • Regulatory and management reports
    • Data quality checks before submission
    • An audit trail from figure to source
    The outcome

    Reporting that is faster, consistent and easy to evidence.

How an engagement runs

Agree the numbers first, then build on them.

  1. Discover

    Your sources, your measures and where they disagree.

  2. Model

    Banking data models loaded and reconciled.

  3. Report

    The first reporting set, built with each team.

  4. Extend

    More teams, more measures, and the AI use cases the data now supports.

Agree on the numbers first.

We will show you the banking data models and dashboards on figures like yours.